300 WATT AMP OUTPUT POWER ANALYSIS.
The 2006 page about my 300W amps requires revision at 2014 due to slight schematic changes.
All the following gives more detail about 300W amp output power character.

To try to understand the working operation with a 300W amp with 12 x 6550, it is important to get
an idea what happens with 2 x 6550. This means load line analysis.
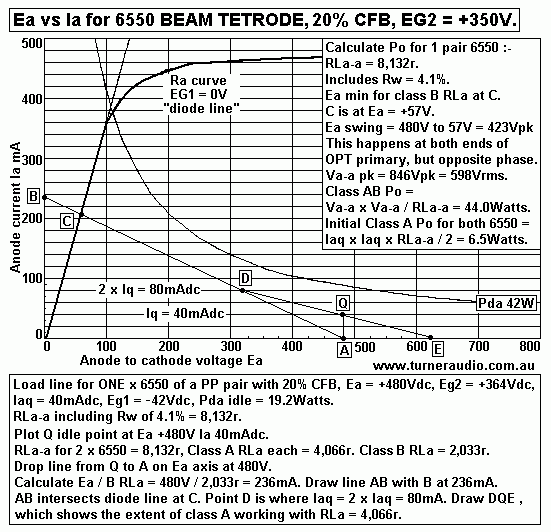
Graph 1.
6550loadlines-20percent-CFB-Eg2=+364V-RLa-a=8k13.gif
Graph 1 shows the approximate Ra curve where Eg1 = 0V for a single 6550 in a pair working in class AB.
Both 6550 have the same idle and load conditions as I use for 6550 in 6 parallel pairs in my 300W amps.
The load line graph confuses most people, because they cannot think what a "load line" could ever be.

Each graph line drawn represents a resistance. The resistance ohm value, R = V / I, which is Ohm's Law.

A straight line is a fixed resistance, and at all points along it, R stays constant. The curved line for anode
resistance Ra for Eg1 = 0V is a non linear resistance. Between 0V and +100V the Ia change = 350mA, and
the line is about straight, so Ra = 100V / 0.35A = 285r for that portion of the curve.
But when Ea rises above 100V, the Ia current change for each volt of Ea change reduces and Ra slopes
over to right side and may be 10k or more. The region of curve where rapid increase in Ra occurs at 420mA
and 150V is called the knee of the Ra curve. The Ra curve for only one value of grid bias is shown to keep
the drawing less cluttered. The Ra curves for any tube may be plotted by setting bias at even values of Eg1
bias, say -35, -30, -25 up to 0V, having a regulated Eg2 applied, then raising Ea while measuring Ia increase.
Plotting Ra curves is a very difficult task for DIYers or low volume amp manufacturers because of time,
complexity, cost, and training needed to get a meaningful set of "Ea vs Ia tube characteristics."

The resistance at any point X along a curve is only valid for a tiny length of that curve, but it may be determined
by drawing a straight line tangent through point X and calculating R from I change for a chosen V change for
the straight line. This is most useful with triode output tubes because Ra lines tend to be gradual curves and
the approximate value of Ra can easily be read from graph to get a damping factor value before GNFB is used.
For 6550 in tetrode mode the Ra can be 32k for Ia at 50mA, and 15k at Ia at 120mA. The Ra is usually much
higher ohms than any load connected and the design may simply be governed by the Ra curve for where Eg1
bias = 0V. Trying to read off old data graphs from 1950s to get Eg1 or Ek values for a wanted Iadc is not reliable,
and anyone building an amp must be prepared to experiment with Rk values and also grid bias values to obtain
the idle currents wanted for a given Ea at idle.

If a tube is set up with Ea = +488V, ie, Vdc between anode and cathode = +488V, and the anode is connected
to an end of OPT winding with low Rw of say 50r, then there is negligible Vdc across the winding which has
a connection at CT to B+.
The OPT primary has high inductance and has high inductive reactance XL. The amount of current change in
the inductance and loading effect is negligible above 50Hz. The anode primary winding acts as though there is
a resistance load strapped across it, being the transformed secondary load. The load line analysis can tell us
just what load ohms exists at different Ea and Ia working points.

Graph 1 shows load lines for 2 x 6550 with load across whole primary, RLa-a = 8,132r. Ra for one tube is
shown and in class AB, the class B RLa = 0.25 x 8,132r = 2,033r. To draw a line of this load, point A is
plotted vertically below idle Ea Q point is plotted on Ea axis at +488V. Then Ia change for 2,033r for
488Vdc applied across it = 488/2,033 = 236mA. Point B is plotted on Ia axis at 236mA, and line AB represents
anode class B load.

Now when a 6550 is turned on by a positive going grid voltage , the anode voltage moves from +488V
down to point C where 2,033r line intersects the Ra curve. The anode current cannot be be increased by
increasing +Eg1. The Ra curve for Eg1 = 0V limits the extent of Ea change.

From just one load we can see what Ea minimum is, at +57V, so peak Vac change at anode = 488V - 57V
= 431V. While one 6550 pulls one end of primary negative, the other end is "pushed" positive from +488V
to +919V, because both halves of primary are magnetically coupled.
During each sine wave voltage cycle in class AB, one 6550 pulls hard on one end of primary while other 6550
s completely cut off by high -Eg1. Each 6550 takes turns to provide current to OPT for 1/2 wave of a sine wave.
This is very different to an SE amp with parallel 6550 where all 6550 have the same Ia rise and fall at the same
points along a sine wave.

Now the 6550 in Graph 1 are not working in a pure class B amp, which requires point Q to be on the Ea axis,
where idle Ia = 0.0mAdc. If this was done, the crossover distortion would be intolerable. So each 6550 has
enough Ia to minimize the distortion so we see the Q point at is Ia = 40mAdc. While there is idle current, when
Eg1 change of opposite phase is applied, the Ia in one is increased, while Ia in other is decreased, and each
tube contributes Ea and Ia change to the load of both halves of OPT primary. This operation is Class A, but it
is limited to where the peak Ia increase and decrease does not exceed the idle current. The class A load which
each 6550 experiences = RLa-a / 2 = 4,066r. Point D is plotted on line AB where Ia = 2 x idle Iadc, at 80mA.
The line DQE is drawn which is the class A load line.

So, we have both 6550 working with load of 4,066r until one of them cuts off and the other then produces all
the power to OPT with load = 2,033r, until the same is done by other 6550 for next half sine wave cycle.
The transition from class A load to class B load is fairly gradual and curved, not a kinked line CDQ.
But the two load line values are the wanted guide for predicting performance.

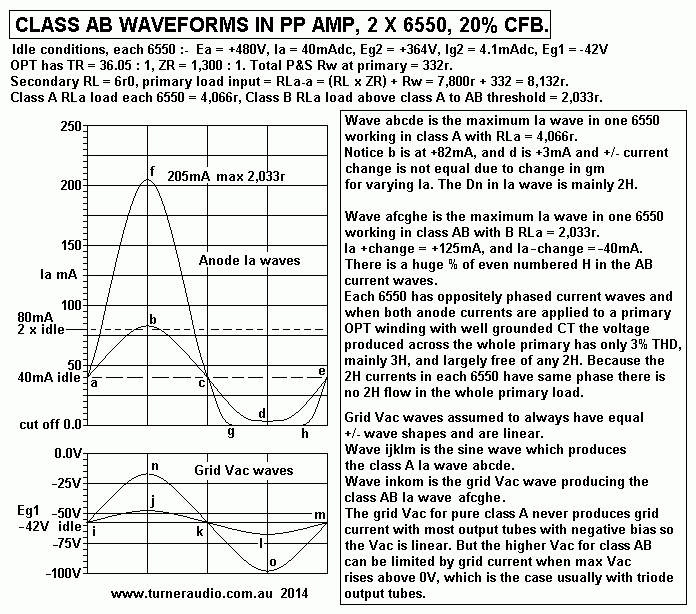
Fig 1. Ea and Ia waves in 6550 in Class AB PP.
Waveforms-Ea-Ia-6550PP-classAB-RLaa-8k1.gif
Fig 1 shows Ea and Ia waveforms and are explained within the drawings. The waves are just what you would
see on an oscilloscope. While the 6550 works in class A, all waves are fairly linear. But as class A ceases and
transitions to class AB up to full clipping level the distortion in Ia waves increases from a few % to very high
% in class AB.
When both tubes work in AB they similarly on each 1/2 sine wave cycle, each 6550 anode contributes the same
current to each 1/2 sine wave but to alternatively to each end of OPT primary, so that the resulting voltage wave
between both anodes is fairly linear even though tube current is very non linear. The Va-a and secondary Vac
across has quite low THD and with 20% CFB it will be < 2% at clipping onset. While the tubes work in pure
class A the THD < 0.5%.

I hope Fig 1 gives everyone an idea about current flow in AB amps. I show the applied grid Vac which gives the
above Ia waves. The Vac waveforms for anodes will have opposite phase to grid Vac, and appear to have
negligible THD without clipping because 2% THD is such a small amount of THD.

Let us returns to Graph 1.
Consider one 6550 of a pair with "anode to anode" primary load of OPT = 8,132r. For the first 6.5W of audio power,
each tube has a class A load of 4,066r, and each provide 3.25W of anode power to each 1/2 OPT primary winding.
For most people, the 6.5Watts in class A is enough to provide all sound level they need, and the operation is with
low THD and IMD. But music has peaks which rise well above average, just as it has troughs in level for quiet
musical passages. The high peaks are brief, and class AB operation is used for them.

The 2H currents of each 6550 are low while in class A but very high in class AB. But the distortion currents are
applied at each end of OPT primary in such a way that there is no difference of applied 2H current across OPT primary,
so there is no 2H voltage generated in primary or secondary windings. There will be 3H and other H currents
produced by both 6550 and which have opposite phases so they do generate 3H and 5H distortion voltage which
may reach 2% at clipping.
 
For design purposes, we need to calculate the performance of each output tube with a number of loads, so that
the optimal speaker load can be chosen with optimal turn ratio.
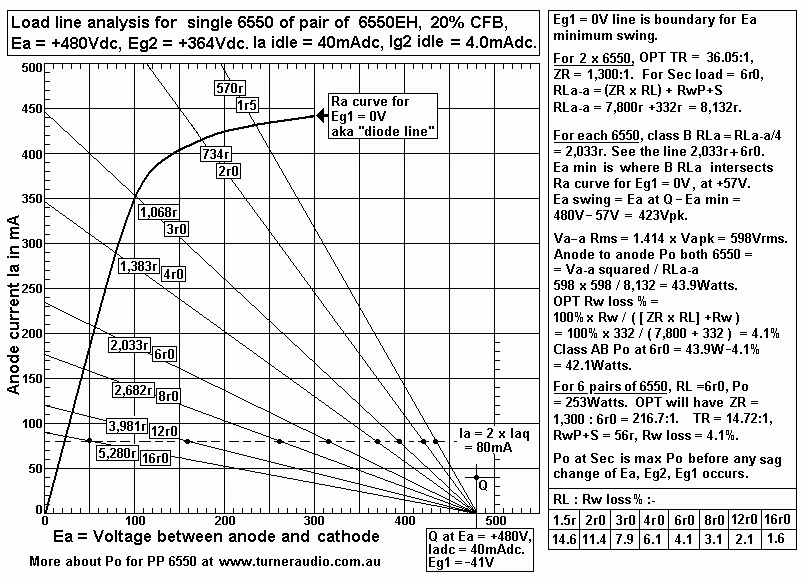
Graph 2.
6550-20percent-CFB-1pair-load-lines-Ea489V-Eg2-363V-nov--2014.gif
Graph 2 shows effect of using 8 different load values. Each 6550 can produce Ia well above the limit of about
2 x idle Iadc for pure class A. With RLa-a = 2,280r, and B RLa = 570r, when output load is 1r5, Ia max can rise
to 430mA pk. The reduction of Ia can only ever be from 40mA at idle to 0.0mA when 6550 is cut off by high negative
going grid Vac.
Graph 2 can cause mental illness but it shows the typical range of loads which should be plotted against the anode
Ra curve for Eg1 = 0V for a single 6550.
Graph 2 has the same example for a 6 ohm load is used as for Graph 1, but 7 other loads are shown.

When I designed the OPT for 12 x 6550, ie, 6 parallel pairs in PP, I decided on an approximate class AB loading for
2 x 6550 with RLa-a at about 8k0 with Ea = 480V, then divided the load by 6 for six pairs of 6550.

To have low winding losses of same % as for 2 x 6550, the OPT for 6 pairs 6550 needed to have core Afe increased
from say 1,600 sq.mm to 5,610sq.mm, Primary turns halved to 1,060t, and wire size 0.6mm dia instead of 0.4mm,
more interleaved 72t sec windings of 0.9mm Cu dia, all to comply to my pages on OPT design.

So OPT has TR = 1,060tP : 72tS = TR = 14.72, and ZR = 216.66 : 1. Primary Rw is about 27r and the transformed
secondary Rw is also about 29r giving total RwP+S = 56r when "looking into" the whole primary.

Your efforts manufacturing an OPT may be different, but by giving basic loading and Rw loss % for 2 x 6550,
the loads and Rw for any number of pairs of 6550 can be worked out.

From what is shown, the maximum class AB1 output power at clipping with music signals can be calculated for
any number of pairs of 6550, and for any speaker load between 1r5 and 16r. The amount of initial pure class A can
be calculated for each load.

Graph 1+2 are valid for where :-
1. Tube is a single 6550EH, KT88EH, one of a pair in PP class AB.
2. Load lines are theoretical class B load including winding resistance calculated for each of the 6 x 6550 used on
each side of PP circuit in 300W amp. See below about interpretation. 
3. Quiescent or idle Ea = +480Vdc, Iadc = 40mA.
4. Idle Eg2 = +364Vdc, Ig2 = 4.0mAdc.
5. I found the Eg1 = -42Vdc for the idle Ea and Ia.
6. The Eg2 B+ supply is fixed Vdc.
7. 20% of primary windings are devoted to local cathode feedback.
8. The Ra curve for what is "the diode line" for Eg1 = 0V has lower knee than for pure beam tetrode, UL,
or triode operation with same Ea and Eg2. The Ra curve is about the same for where Eg2 = +350V with Ea at idle
between +400V and +500V, and pure beam tetrode operation.
9. The operation of ONE 6550 is in graph, and load lines have 6 times the ohm value for what is used when 6 x 6550
are in parallel on each side of PP circuit.
10. The anode and screen B+ supplies remain regulated during class AB operation.
11. The test signals are single frequency sine waves of 400Hz to 1kHz.
12. Calculated RLa loads are labeled "2,033r - 6r0" because you need to know what each of many B RLa lines tell
you without being confused.

The 300W amp was tested with a continuous 500Hz sine wave to verify the predicted outcomes in Graph 1&2.
For loads below 6r0, clipping power with a continuous sine wave causes B+ anode voltage supply to sag.
With RL 3r0, anode B+ current increase from 0.5Adc to 1.2Adc and B+ Vdc to sag from +512Vdc to +480Vdc,
giving Ea change from+489V to +456Vdc.

Eg2 will also drop and Eg1 will slightly increase.

The PSU output resistance is approximately 50 ohms, being the sum of PT Rw, choke Rw, series R with diodes
to limit cap charge currents, and ripple voltage at caps.
The measured Po with loads above 7r0 was slightly higher than theory suggests so the Ra diode line value of
285r may in fact be less, and be more curved towards the Ia axis. But for design purposes, the shape for Ra at
0V for this application and tube Ea and Ia conditions, it is accurate enough.

Pink noise signals with poles f1 and f2 at 20Hz to 20kHz are quite good for testing amps because the noise
resembles music, where the maximum average level of music power might only be 1/4 of the clipping Po with a sine wave.
The noise or music signal will have voltage peaks rising well above average voltage peaks and these will cause amp
to clip, and when that happens all other frequencies or lower level signals are obliterated.

So it doesn't take much clipping of peaks to ruin music, and of course the universal remedy to allow more of everything
to be heard more loudly while reducing the peak levels is to apply compression to the signal. So music from an FM
station playing rock and roll is extremely loud with heavy compression while FM stations focused on classical music
remain almost silent most of the time except for crescendos which occupy full headroom, but all without clipping.

If peak maximum voltage levels for onset of clipping with pink noise can be measured by comparison with a known
Vac and on oscilloscope, then the theoretical performance in all graphs will be verified most easily because the
average power with music or pink noise is low and very high AB Po occurs for short times, seldom long enough to
seriously change the Vdc at OPT CT, Eg2, Eg1.

How were load lines for Graph 1 & 2 calculated and drawn?

Above, I said the 300W amp for 6 parallel pairs 6550 has OPT with TR = Primary 1,060t : Secondary 72t = 14.722 : 1,
ZR = TR squared = 216.72. Rw total at primary = 56r.

If we wish to draw a graph for Po vs RL for 300W amps with 12 tubes we may be confused, so I think it better to draw
load lines for an amp with only 2 x 6550 working with identical loadings to each of 6 parallel pairs in 300W amp.

Then the Po performance of 6 pairs of 6550 becomes 6 x Po for 1 pair 6550.

Most books and present worldwide interest in PP amps will have ONE pair of output tubes and easy comparisons
may be made between my solutions to tube loading and other solutions. But many manufacturers are extremely shy
about revealing the real working conditions in their amps and that was why my bench had so many brand name
amps needing "re-engineering".

OPT ZR for 2 x 6550 = ( 6 x 216.7 ) : 1 = 1,300 : 1, TR = 36.05 :1. Assume winding loss % is the same for OPT
for 2 x 6550, so RwP+S = 56 x 6 = 336r.

Calculate RLa-a including RwP+S :-
RLa-a = OPT primary load = ( ZR x RL ) + RwP+S.
Example, if Sec RL = 6r0, RLa-a = (1,300 x 6 ) + 336r = 8,136r, class A RLa load for each 6550 = 4,068r
for initial class A Po, and class B RLa load for each 6550 in class AB = 2,034r.
Table 1.......
Sec
RL for 2 x 6550
P:S OPT
ZR = 1,300 :1 ZR x sec RL
RLa-a = ZR x RL + RwP+S
+336r. 
Total
Rw
Loss%
Class AB
B RLa
for 1 x 6550 =
0.25 x RLa-a
load line
B RLa
Intersect diode
line = Ea min
Ea pk swing =
Ea - Ea min = Va pk
Va-a
across primary
Vrms
Anode Po
RLa-a
for 2 x 6550
Sec AB1
Po
less
Rw % loss
Sec
pure
class
A Po
Sec
AB1
Po
12 x 6550
1r5
1,950r
2,286r 14.6%
571r
235V
245Vpk
346V
52.4W
44.7W
1.6W
268W
2r0
433r
2,934r 11.4%
733r
175V
305V
431V
63.3W
51.9W
2.1W
311W
3r0
650r
4,236r 7.9%
1,059r
100V
380V
537V
68.1W
62.7W
13.2W
376W
4r0
866r
5,532r 6.1%
1,389r
80V
400V
565V
57.7W
54.2W
4.2W
325W
6r0
1,300r
8,136r 4.1%
2034r
57V
423V
598V
43.9W
42.1W
6.5W
263W
8r0
1,733r
10,734r 3.1%
2,683r
45V
435V
615V
35.2W
34.1W
8.3W
205W
12r0
2,600r
15,602r 2.1%
3,900r
30V
450V
636V
25.9W
25.4W
12.5W
155W
16r0
3,467r
21,138r 1.6%
5285r
13V
467V
660V
20.6W
20.2W
16.6W
121W

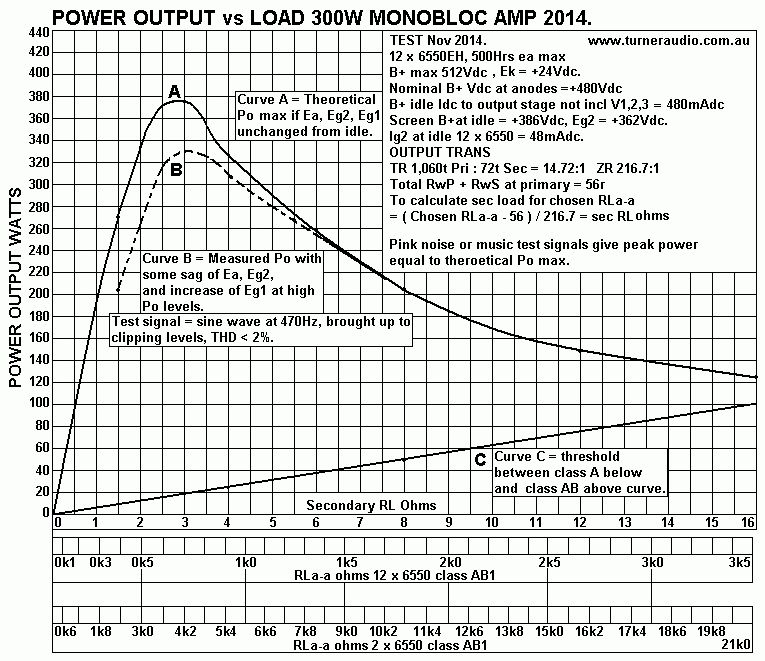
Graph 3. Po vs RL
300W-amp-TherPo+measured-vs-RL-RLa-a-nov-2014.gif
Graph 3 Curve A is the theoretical maximum clipping levels for Po providing the Ea, Eg2, and Eg1 all stay
unchanged between idle condition and highest maximum power drawn from PSU.

Curve B was the the result of careful measurements of the finished amp using a 470Hz sine wave. With RL more
than 7r0, RLa-a 1k7, there is little difference between measured Po and theoretical Po based on Graph 1
curve for Ra with Eg1 = 0V.

Below RL 7r0 and RLa-a = 1k7, the measured Po at clipping becomes lower than theoretical because Ea and
Eg2 have sagged under high Idc draw, and Eg1 has risen. At clipping with RL 2r0 the sag in Ea is from 483Vdc
at idle to 435V. Eg2 sags from +364V to +335V, and Eg1 increases from -42V to -46Vdc. The rise in Ek is not
all prevented the DBS circuit.

Graph 3 has each vertical graticule spaced at 1/2 ohm steps with sec RL values under graph. Below this there is
a scale for RLa-a anode load for 12 x 6550. The OPT secondary is strapped for 6 parallel 72t windings.
The RLa-a loads for just 2 x 6550 are shown along bottom of graph.

For example, look at theoretical Po max for 3r0. It is 376W. Continuous sine wave gives 329W.
Below 3r0 load on sec RL scale, for 12 x 6550 the RLa-a = 0k7, ie, 700r. The RLa-a for 2 x 6550 = 4k2.

You can see that the load for 2 x 6550 is exactly 6 times the load for 12 x 6550. Each pair of 6550 can make
1/6 of the output for 6 pairs of 6550, based on the same loading and winding loss % which is included in all
load values shown on the graphs.

Most text books ignore the winding losses, I don't. So if you have 2 x 6550, with same Ea and Ia conditions,
you can get an absolute maximum of 62W with THD < 2%.

The ideal nominal load value for OPT sec set for 72t = 5.5 ohms. With 12 x 6550, expect the first 34Watts in
pure class A, and peak AB Po = 270W, with RLa-a for each pair 6550 = 6k7. It means that all "8 ohm" speakers
can be used where their Z is between 5r0 and 50r. For 34W in class A from 12 x 6550, expect THD < 0.05%.
2 x 6550 could make 5.7W in class A, also with 0.05%. But the same 2 x 6550 amp making 34W in class AB
may have 0.5% THD with the same amount of GNFB.

The OPT has 12 secondary windings, 6 x 24t and 6 x 48t. These can be re-arranged for other loads :-
Table 2.
Primary
turns
1,060t
RLa-a
Ohms
Sec RL
Ohms
9 // 48t
Sec RL
Ohms
6 // 72t
Sec RL
Ohms
4 // 96t
Sec RL
Ohms
3 // 144t
Sec RL
Ohms
2 // 216t
Sec RL
Ohms
1 x 432t
Class A
max
Watts
Class AB
max
Watts
800r
1.64
3.69
6.56
14.76
33.22
132.87
21
322
1k2
2.46
5.53
9.84
22.12
49.74
199.08
32
270
1k6
3.28
7.38
13.12
29.52
66.43
265.75
45
226
2k4
4.92
11.07
19.68
44.28
99.48
398.62
68
160
3k2
6.56
14.76
26.24
59.04
132.86
531.50
91
135
4k8
9.88
22.14
39.36 88.56
198.96
797.24
92
92
6k4
13.12
29.52
52.48
118.08
265.72
1,063.00
68
68
All the above is enough to hopelessly confuse most technically minded people let alone non technical audiophiles.
To make it easier to choose the secondary winding strapping.....
Table 3.
Watts
per channel
Speaker Z
4r0 Nominal
Vrms

Speaker Z
6r0 Nominal
Vrms

Speaker Z
8r0 Nominal
Vrms

Speaker Z
12r0+
Vrms
50W home
9 // 48t
14.1

9 // 48t 17.3

6 // 72t
20.0

6 // 72t 24.5
100W home
9 // 48t
20.0

9 // 48t
24.5

6 // 72t
28.3

6 // 72t
34.6
150W home - pro
9 // 48t
24.4

6 // 72t
30.0

6 // 72t
34.6

6 // 72
42.4
300W pro
9 // 72t
34.6

6 // 96t
42.4

4 // 96t
49.0

3 // 120t
60.0

Professional use of a 300W amp may involve say 4 speakers each rated for 75W continuous. These may be in
series / parallel to make a total load between 3r0 and 12r0.
Very careful calculations are needed for a system which may vary the number of speakers required, but where
a system in a theatre remains fixed there is less chance of change and smoke. The secondaries set for 2 // 216t
can give 106Vrms for 300W into 37.5r or all sec in series gives 212Vrms for 150r. Such higher voltage signals
can be sent via 5A rated cables over long distances with line transformers to reduce voltage and increase current
to speakers. But why would anyone waste such amplifiers on Public Address, ie, PA sound? I have known of some
high power and elaborate tube amps supplied to movie theatres around Australia in 1960s and 70s, some of them
lasting until after 2000, but despite fabulous stereo sound for one theatre, most were dumped when many
theatres closed to be replaced by "complexes" with 6 smaller theatres instead of one, and with surround sound, all
with central control so only one man was needed to show 6 movies and without worrying about replacing 400 tubes.

The 300W amps have a range of HT Vac available at PT1 mains transformer. For anyone wanting more class A and
less class AB, Ea might be lowered but Idle Ia kept constant, so the input power is say 500mA x 400V so that
total Pda is reduced from 256W to 200W thus saving electricity costs, while extending tube life. Strapping of OPT
sec will allow other load matches to increase class A with low Z speakers.

There is no hard law requiring everyone to use 12 x 6550 set up produce high Po which many people would think
excessive. Many would find 12 x 6550 give extraordinarily relaxed listening and fabulous untiring fidelity. In winter,
their warmth is a blessing in a cold room, and winter use will mean other room heating will use less power, and the
cost of winter music is a small and affordable difference in heating efficiency.

It must always be remembered that pure class A power is expensive because The wanted class A audio power
is always about 40% of total idle power and not including the filament heaters.

There is no law against using 12 x 6L6GC in the 300W amp with each idling at 15.0W with Ea = 350V and Ia in
each = 40mA. Total Pda = 180W and total filament power = 72W, with another 15W for input tubes, so so 267W total.
This can yield 80W of pure class A and 170W of class AB. 6L6GC are widely available and quite cheap, and sound well.
KT66 and EL34 also can be used with slightly more filament power.

You are at
300W amp power vs load graphs

To other pages...
300W amp input/driver and output stages 
300W amp power supply
300W amp active protection
300W amp dynamic bias stabilization
300W amp images, tubes with blue glow, and more views of amps

Back to Power amplifiers

Back to Index Page